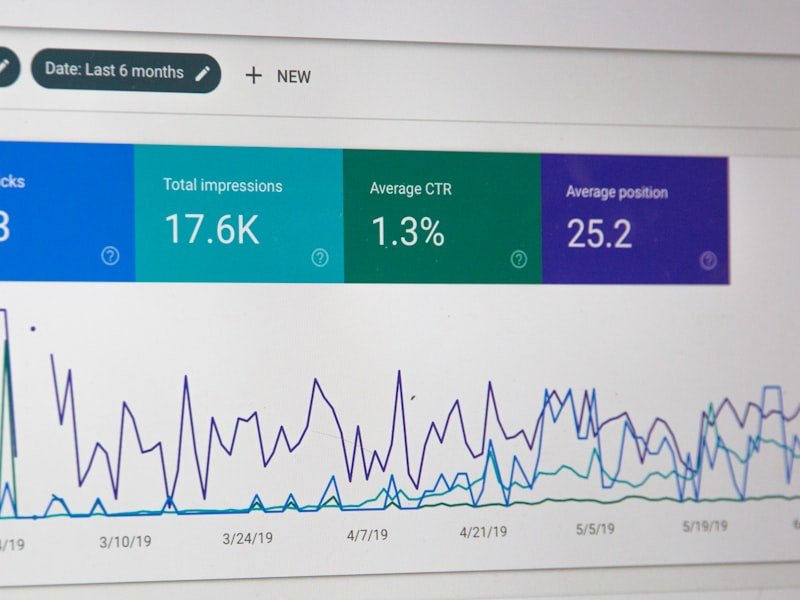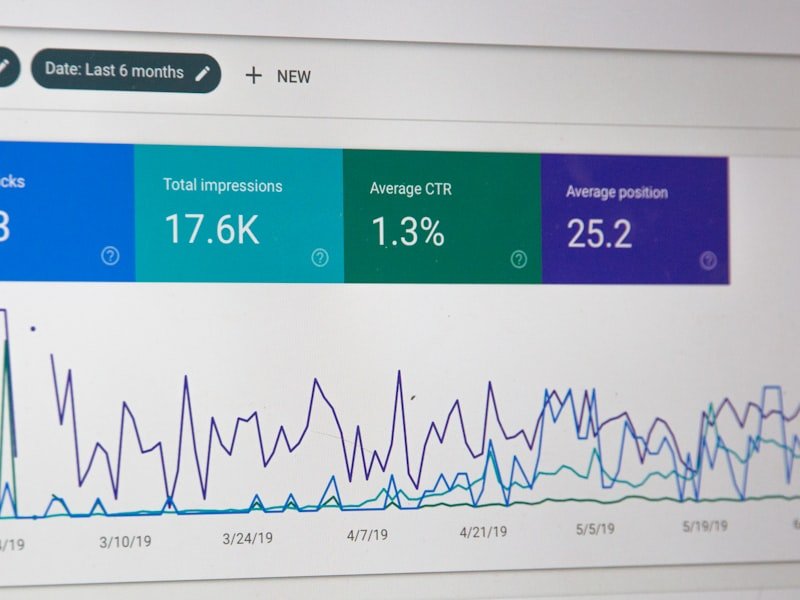
Marketing dashboards love big numbers: impressions, reach, followers. They look impressive in a meeting, but they don't tell you whether the business is growing. These are the six numbers we put at the top of every client report.
1. Cost per acquisition
How much you spend to win one new customer. Divide total marketing spend by the number of new customers in the same period. If it keeps rising, something in the funnel needs attention.
2. Conversion rate
The share of visitors who do what you want: buy, book or send an enquiry. Improving it makes every channel cheaper at once, which is why it is often the best place to start.
3. Return on ad spend
Revenue from ads divided by what the ads cost. Look at it together with your profit margin; a figure that looks healthy can still lose money if the margin is thin.
4. Customer lifetime value
How much an average customer spends with you over the whole relationship. When you know it, you know how much you can afford to spend to win a customer in the first place.
5. Lead-to-customer rate
For service businesses, a pile of leads means little if few of them become paying clients. Track how many do. It shows whether marketing is bringing the right people and whether sales is following up quickly enough.
6. Repeat purchase rate
The share of customers who come back and buy again. Keeping a customer usually costs far less than finding a new one, and this number shows how well you do it.
Keep the report simple
- Put these six numbers on one page and compare them month by month.
- Write one or two sentences explaining why each moved.
- Agree on one action for the coming month.
A worked example
Say you spend 10,000 on ads in a month and win 50 new customers. Your cost per acquisition is 200. If each customer spends 600 with you over time and your margin is 40%, each one brings 240 in profit, so the campaign works, but with little room to spare. Raising the conversion rate or the repeat purchase rate would make it clearly profitable.
Metrics that can mislead you
- Impressions and reach: useful context, but not results.
- Click-through rate on its own: lots of clicks can still mean zero sales.
- Follower count: a small engaged audience often sells more than a large passive one.
Frequently Asked Questions
How often should I review these numbers?
Look at ad performance weekly and at these six business metrics monthly. Quarterly reviews are a good moment to change strategy, not just tactics.
What is a good ROAS?
It depends entirely on your margins. A business with high margins can grow profitably at a lower ROAS than a business with thin margins. Work out your break-even ROAS first.
Which tools do I need to track this?
Google Analytics 4, your ad platforms, your store or CRM, and one simple dashboard, such as Looker Studio or a spreadsheet, that pulls it together.
If a number can't change a decision, it doesn't belong at the top of your report.